The Glass Transition Temperature Measured by Different TA techniques. Part 2: Determination of Glass Transition Temperatures
Introduction and Experimental Details
In Part 1 of this study, we presented an overview of the thermoanalytical techniques used for the determination of the glass transition [1]. In this second part, we would like to describe measurements performed using different TA techniques, compare the results and discuss the various points that should be taken into account. In order to make a meaningful comparison, polystyrene (PS) was chosen for analysis because it gives reproducible measurement results with all the techniques used. Samples for each TA technique were cut from a 2.2-mm thick polystyrene sheet and thermally pretreated directly in the individual measuring instruments.
This was done by first heating the samples to 140 °C and then cooling them under different conditions depending on the type of analysis to be performed afterward. The measurements were performed with METTLER TOLEDO DSC822e, TMA/SDTA840, TGA/SDTA851e and DMA/SDTA861e instruments; the STARe software was used to evaluate the results.
DSC, TMDSC and SDTA Measurements
The same sample (26.72 mg) in a 40-µl aluminum crucible was used for these measurements. After heating, the sample was shock-cooled by quickly removing it (within about 6 seconds) from the furnace using the sample robot and placing it on the cold turntable. The glass transition temperature was determined according to ASTM standard E1356 (practically identical to IEC 1006). This gives the midpoint temperature between the extrapolated onset and endset. Differences in the glass transition temperature so determined can arise because the value obtained depends on how the tangents are drawn. The tangents represent the extrapolation of the heat capacity curve above and below the glass transition and must be constructed with care. When different measurement curves are compared, the tangents should be drawn so that they are in each case parallel to one another. If other standard methods (e.g. DIN 53765, ISO 11357-2) are used, differences arise due to the different evaluation procedures.
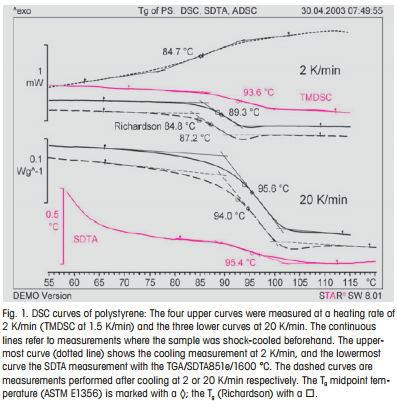
Figure 1 displays the DSC curves together with the tangents used for the determination of the glass transition temperatures. The purpose of using two heating rates is to show the effect of this parameter on the glass transition temperature. As can be seen in Table 1, the glass transition temperature of polystyrene at 20 K/min is about 10 K higher than in the measurement at 2 K/min. There are three main reasons for this temperature difference. First of all, the glass transition temperature determined according to ASTM E1356 is not thermodynamically defined, but is influenced by the actual shape of the curve. Second, the DSC curve is deformed or “smeared” at increasing heating rates due to temperature gradients in the sample and sensor [2]. Third, the thermal glass transition (also known as devitrication) is a kinetic process controlled by cooperative molecular rearrangements in which time is an important factor. Here the Deborah number (D) is important, i.e. the ratio of the characteristic time of the cooperative rearrangements (τa) and the observation time (tb) [1]. In practice, τa decreases with increasing temperature, and tb is shorter with increasing heating rate. The glass transition takes place when D ≈ 1.
The state of the sample at the glass transition is described by the determination of the fictive glass transition temperature (according to Richardson) [3]. With cooling curves, the glass transition temperature determined according to Richardson corresponds to that determined by the ASTM method. This is the reason why the glass transition temperature obtained from the cooling curve is in very good agreement with the fictive temperature, Tg, according to Richardson if this is determined from the heating measurement that follows. The glass transition temperatures of samples that have been slowly cooled (cooling rate ≤ heating rate) are generally lower (here about 2 K) than those of rapidly cooled samples. In temperature-modulated DSC (TMDSC), the glass transition temperature is measured in a frequency-dependent experiment. At 20 mHz (period 48 s), the value is about 4 K higher than in the corresponding DSC measurement at 2 K/min (see Table 2). A measurement at a constant heating rate of 2 K/min corresponds to a frequency of less than 1 mHz [4] (see also frequency dependence with DMA).
 |
Conclusions
The results show that the glass transition can be measured with all the different methods. Each technique, however, yields different values for the glass transition temperature. There is not just one “correct” glass transition temperature. If the heating rate and the sample pretreatment are the same, DSC and TMA can provide comparable results. When comparing values with DMA results, the measurement frequency must be taken into account. Compared to the DSC or TMA measurements (10 K/min corresponds to about 2 mHz), the DMA measurement at 1 Hz (about 3 decades higher frequency) yields a Tg that is about 15 K higher. This difference is due to the different type of stress applied to the sample. Any glass transition temperature quoted must therefore be accompanied by details of the measuring technique, the heating rate, the thermal and mechanical sample pretreatment and, if appropriate, the frequency. The characteristic features of the TA techniques for the determination of the glass transition have already been discussed in Part 1 of this study. The best method to study any particular analytical problem can be judged from Table 3.
The Glass Transition Temperature measured by Different TA techniques. Part 2: Determination of Glass Transition Temperatures | Thermal Analysis Application No. UC 181 | Application published in METTLER TOLEDO Thermal Analysis UserCom 18

