Interpreting TMA Curves
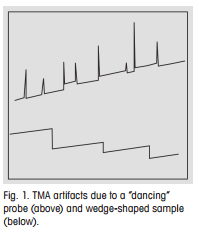
Artifacts
Artifacts can sometimes be observed in thermomechanical analysis:
- When the force exerted by the probe on the sample or the fused silica disk covering the sample is very weak. The probe can then begin to jump around or “dance” on the sample. This leads to an extremely large noise level or spikes (≥0.5 µm). If vibrations in the building are the cause of the problem, install the TMA on a stone bench with oscillation dampers. Otherwise, increase the load to at least 0.01 N.
- When the surfaces of a sample are not parallel, i.e. with wedge-shaped samples. This often gives rise to artifacts that resemble a series of steps. This is caused by the sample slipping stepwise down the sloping surface of the sample.
Measurement Modes
Dilatometric measurements are used to determine the coefficient of thermal expansion. They are performed under conditions of low compressive or tensile stress in order to prevent deformation of the sample. The compressive stress, i.e. the force per area, is kept low by applying a very weak force (e.g. 0.01 N) over a large sample area (quartz glass disk between the sample and the ball-point probe). Since most materials have positive coefficients of expansion, a dilatometric curve exhibits an upward tendency with increasing temperature, unless the sample contracts in certain regions due to changes in internal stress or orientation.
TMA measurements are performed using a significant force e.g. 0.5 N. The standard measurement modes are penetration and bending. The aim is to measure the deformation of the sample under load. The ball-point probe is often used for penetration experiments. Initially, only a small area of the probe is in contact with the sample. As soon as the sample softens, the probe penetrates more and more into the sample, resulting in a rapid increase in the area of the probe that is in contact with the sample.
Whether the measurement has a more dilatometric character or is in fact a TMA measurement depends on the applied force and the stiffness of the sample. For example, the dilatometric curve of a quartz crystal can be measured with a force of 0.5 N without any sign of the sample deforming. In contrast, if an organic substance, e.g. an edible fat between quartz glass disks, is measured through the melting region with 0.01 N, then the expansion is only visible when the fat is in the solid state. On melting, the stiffness sinks to such an extent that the slightest force squeezes out or deforms the liquid. With metals, a larger force is needed to squeeze out the melt, e.g. 0.5 N, because the oxide film on the surface also has to be deformed.
DLTMA measurements are TMA measurements performed with a periodically changing load. If the two forces are properly chosen, it is in fact possible to alternatively measure sections of the dilatometric curve at low load and sections of the penetrometric TMA curve at high load. With polymers, however, the transition is delayed, especially in the glass transition region, due to the effects of relaxation processes.
TMA measurements are usually performed with a dynamic temperature program at a rate of 2 K/min to 10 K/min, very often at 5 K/min. The measurement is normally terminated before the sample decomposes (to avoid contamination of the sample holder due to molten or foaming decomposition products).
 |
Final remarks
The information presented above on the origin and physical and chemical background of typical TMA effects should help you interpret your own measurement curves. If the interpretation of the results is still unclear, you might well consider using other techniques such as:
- DSC and TGA measurements,
- the analysis of any gaseous compounds evolved (EGA),
- the observation of the sample under the hot-stage microscope
Interpreting TMA curves | Thermal Analysis Application No. UC 141 | Application published in METTLER TOLEDO Thermal Analysis UserCom 14

