Heat Capacity Determination at High Temperatures by TGA/DSC. Part 2: Applications
In Part 1 published in UserCom 27, we showed how cp values of materials can be measured up to 1600 °C [1]. This second article presents various applications such as the determination of cp changes at glass transitions and in 2nd order phase transitions. It describes how a change in mass that occurs in a decomposition reaction can be taken into account in cp determination and how the process enthalpy is determined
Introduction
Differential scanning calorimetry (DSC) offers several different measurement procedures for determining the specific heat capacity (cp) [2]. The direct method and the sapphire method were discussed in Part 1. An important conclusion was that only the sapphire method yields reliable results. This second article presents a number of applications that have been performed with this method.
Determination of cp Changes
The following examples describe several application possibilities of the sapphire method for the determination of cp at high temperatures. The measurements were performed using a METTLER TOLEDO TGA/DSC 1 equipped with an HSS2 sensor. A platinum crucible with lid was used in all the experiments. The curves are blank corrected.
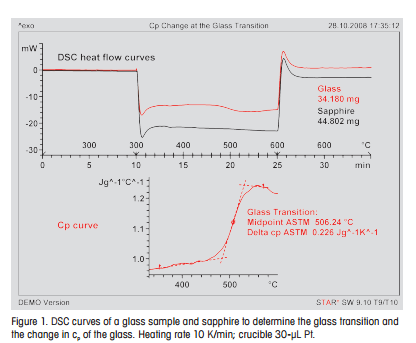
Change in cp at the Glass Transition
The glass transition is accompanied by a noticeable change in the specific heat capacity. This change can be measured using the sapphire method, as shown in Figure 1 using a sample of glass as an example. While the characteristic glass transition temperature can be read directly from the DSC curve, the overall course of the cp and the magnitude of the change at the glass transition can only be obtained from the cp curve.
Change in cp in Second Order Phase Transitions
Second order phase transitions show a characteristic change in the specific heat capacity without additional energy (latent heat) being involved. The change is observed as an apparent endothermic effect on the DSC heating curve of a suitable sample. The temperature dependence of cp is measured using the sapphire method. The example in Figure 2 shows the cp function of cobalt around the Curie point at 1120 °C (1393 K). The cp curve exhibits the typical l-shape. The measurement values lie in the range of literature values for cobalt and the standard deviation is about ±10%.
Change in cp in Decomposition Reactions
The determination of the specific heat capacity assumes that the sample does not change.
If this is not the case, for example in a decomposition reaction, the sapphire method measures an apparent specific heat capacity. To determine the cp values of the starting material and the end product, the change in mass must be taken into account.
The combination of the TGA and DSC techniques in the TGA/DSC 1 allows mass and enthalpy changes to be simultaneously measured using the same test specimen. The thermal decomposition of calcium carbonate to calcium oxide is studied as an example. The heat flow measured during the decomposition of the calcium carbonate includes a latent heat component that is determined by the reaction enthalpy. The TGA and DSC curves are shown in Figure 3. The pure calcium carbonate decomposes in a nitrogen atmosphere to calcium oxide, which remains behind as a residue. Stoichiometrically, a mass loss of 43.97% occurs.
The specific heat capacity of CaCO3 measured before decomposition (which begins at about 600 °C) agrees well with the literature value (Figure 4). Afterward, cp increases due to the overlapping decomposition enthalpy. The curve corresponds to the apparent specific heat capacity. After the reaction is completed, the cp value determined is too low if normalization is performed as usual with respect to the original starting mass (dashed curve). Normalization with respect to the starting mass gives incorrect results because calcium oxide is left behind after the reaction and not calcium carbonate.
The STARe software allows the cp calculation to be performed with respect to the changing mass. The result of this calculation is shown in Figure 4 as the red curve (mass corrected). It shows that correct values are obtained for the calcium oxide.
A second heating run of the same test specimen (Figure 3) yielded the cp curve of CaO for the entire temperature range as shown by the blue curve in Figure 4. Since no mass change occurs, the calculation can be made with constant starting mass. In the example shown, this corresponds to the residue from the first heating run. At 1100 °C, the cp values of both measurements agree well.
Determination of the Process Enthalpy from cp Measurements
The energy required in a thermal process (the process enthalpy) is the sum of the heat needed to heat the material (the sensible heat) and the reaction enthalpy (the latent heat). Both these values can be calculated from the cp curve, whereby the process enthalpy is always evaluated with respect to the initial mass. The enthalpy and its change as a function of temperature are determined by integrating the cp curve. This is explained using the calcination of CaCO3 again as an example.
 |
Summary and Conclusion
In Part 1 it was shown that the sapphire method is ideal for determining the cp at temperatures up to 1600 °C [1].
In Part 2, the change in cp that occurs during different thermal events is investigated. The glass transition of an inorganic glass and the second order phase transition of cobalt are presented as examples. The mass of a sample usually remains constant during cp determination. If a chemical or physical change involving latent heat occurs, an apparent heat capacity is determined. In a decomposition reaction, the mass of the sample also changes. This mass change must be taken into account in order to determine correct cp values of the starting and end products. The integration of the cp curve with respect to temperature yields the enthalpy of a process. This was shown using the calcination of CaCO3 as an example.
Heat Capacity Determination at High Temperatures by TGA/DSC Part 2: Applications | Thermal Analysis Application No. UC 281 | Application published in METTLER TOLEDO Thermal Analysis UserCom 28