Curve Interpretation, Part 1: Variation of Experimental Conditions
The thermal analysis measurement programs most frequently used in practice consist of a single heating segment. In such simple experiments, the possibilities of the measurement methods are of course by no means exhausted. Misinterpretation of the measured effects is possible due to the relatively small amount of information obtained. In this series of articles, we present a number of simple ways to increase the information content of measurements. In this first article, we discuss the possibilities of repeating the heating measurement after cooling, variation of the measured temperature interval, and measurements in different atmospheres.
Introduction
In the narrower sense, thermal analysis consists of the following analysis methods:
- DSC (Dynamic Scanning Calorimetry)
- TGA (Thermogravimetric Analysis)
- TMA (Thermomechanical Analysis)
- DMA (Dynamic Mechanical Analysis)
These methods are well established in industry and research because they supply reliable and comprehensive information about a material or a substance in a relatively short period of time.
However, due to the many possibilities for varying measurement programs, the methods have a large potential that is not exploited.
The reason for this is that a measurement usually consists of a single heating run recorded at just one heating rate (e.g. 10 K / min in the DSC).
This article is the first of a series of five articles that describe approaches by means of which the information content of thermal analysis measurement curves can be increased and the quality of evaluations improved. In this first article, we want to show how additional information can be obtained by modifying the experimental conditions, such as by repeating measurements, by varying the temperature range or by changing the atmosphere.
In the second article, we will focus on information that can be gained by varying the heating and cooling rates. The last three articles will describe how information about a material can be obtained through a combination of different thermal analysis techniques.
Identification of Small Differences by DSC
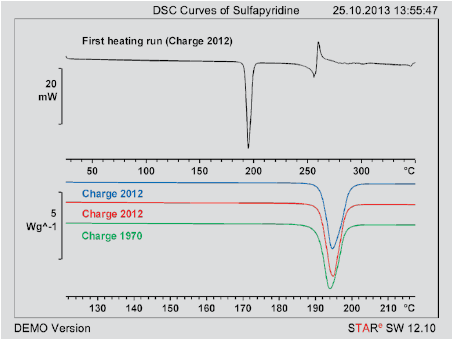
In practice, just one single DSC measurement is often made to detect differences between different samples. The measurements are usually performed at a heating rate of 10 K / min. Limitations that result from such a measurement strategy are shown in Figure 1 in the DSC measurement of sulfapyridine.
The example shows a typical DSC measurement from 30 to 400 ° C at 10 K / min. DSC measurements like this are frequently performed in order to measure all the thermal processes that occur in one measurement run...
Download the full text of this article below.
Conclusions
In practice, thermal analysis methods usually consist of just one single heating measurement. The information content of such measurements, the reliability of the interpretation and not least the accuracy of the measurement results can however be considerably improved through suitable variation of the experimental conditions. In this first article, we have highlighted three approaches:
- simple repetition of a measurement after ( more or less ) defined cooling.
- variation of the temperature range to improve the evaluation of certain thermal effects.
- variation of the atmosphere to study the reaction of samples with gases or to evaluate the influence of relative humidity on the physical and chemical properties.
In the next article in this series, we will concentrate on how additional information can be obtained by varying the heating and cooling conditions.
Curve Interpretation, Part 1: Variation of Experimental Conditions | Thermal Analysis Application No. UC381 | Application published in METTLER TOLEDO Thermal Analysis UserCom 38