Interpreting DMA Curves, Part 1
The first part of this work introduces the technique of dynamic mechanical analysis (DMA) and deals with nonisothermal DMA measurements. The second part (UserCom16) will cover various aspects of isothermal measurements, concentrating primarily on frequency-dependent elasticity.
Introduction
By the term elasticity we mean the way in which materials change their shape through the action of external forces. The modulus of elasticity of a material is the ratio of the mechanical stress to the relative deformation. In Dynamic Mechanical Analysis, DMA, a sample is subjected to a sinusoidal mechanical deformation of frequency, f, and the corresponding forces measured. Conversely, the sample can be subjected to a defined force amplitude and the resulting deformation measured.
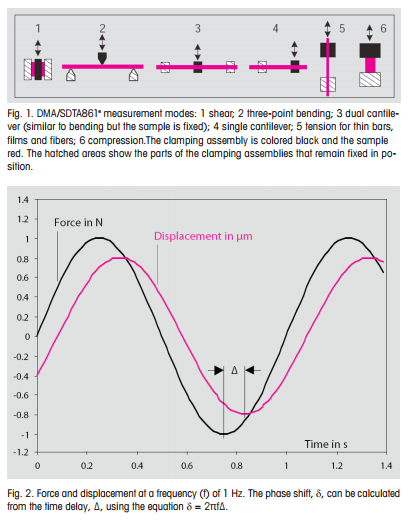
Measurement Modes
A number of different measurement modes are used:
- Shear for samples with a shear modulus in a very large range from about 1 kPa to 2 GPa. This allows viscous liquids and even solid samples, e.g. polymers in the glassy state, to be measured.
- Three-point bending for stiff samples with a modulus of elasticity of up to 1000 GPa.
- Tension for thin bars, films and fibers
- Compression for samples with a modulus of elasticity of up to about 1 GPa.
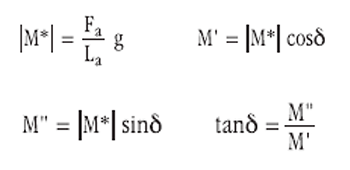
The Quantities Measured
The raw data, i.e. the measured force and displacement amplitudes, Fa and La, and their phase shifts, δ, are used to calculate the desired material properties:
- Complex modulus (M*): modulus of elasticity, Young’s modulus (E*) or shear modulus (G*)
- Storage modulus, M′, proportional to the energy stored elastically and reversibly
- Loss modulus, M”, proportional to the energy transformed into heat and irreversibly lost
- Loss factor, tan δ. With completely elastic materials no phase shift, δ, occurs; completely viscous materials show a 90° phase shift. The loss factor of viscoelastic materials is between 0 and infinity (δ = 90°). The term tan δ corresponds to the ratio of M” to M’
The moduli are calculated according to the following formulas:
where g is known as the geometry factor calculated from the sample dimensions.
E and G are related by Poisson’s ratio,µ:
E = 2 (1+µ) G
For most isotropic materials, µ lies between 0.2 and 0.5, and E is 2.4 to maximum 3 times greater than G. In the rubbery-elastic region of unfilled materials, E ≈ 3 G and in the glassy state E = 2.7 G. With anisotropic materials, e.g. unidirectional fiber reinforced plastics, E can be more than one hundred times larger than G.
 |
Final Comments
DMA measurements provide an insight into temperature- and frequency-dependent molecular movement, and also supply the engineer with information on material properties regarding stiffness, damping behavior and the range of temperature in which materials can be used. DMA measurements show especially well how the glass transition depends on factors such as moisture or the degree of curing (see UserCom11, pages 8 to13).
When unknown samples are measured with DMA, it is always a good idea to perform a DSC measurement at 20 K/min over a relative large temperature range. From the DSC curve one can often choose a reasonable temperature range for the DMA measurements to prevent the sample from melting completely or decomposing in the DMA. This also gives one the opportunity to perform a second measurement on the same sample, if need be, even with new sample geometry.
In general, DSC measurements aid the interpretation of DMA curves (and vice versa). DSC and DMA measurements provide different information and complement one another ideally; one technique cannot however replace the other.
Interpreting DMA curves, Part 1 | Thermal Analysis Application No. UC 151 | Application published in METTLER TOLEDO Thermal Analysis UserCom 15

