Thermal Analysis of Polymers. Part 6: TMA and DMA of Elastomers
In Part 5 [1] of this series of articles, we described the most important effects that can be investigated by DSC and TGA in the field of elastomers. Part 6 focuses on effects and properties of elastomers that can be measured by TMA and DMA. These include expansion, the glass transition, the modulus (frequency dependence and master curves), creep behavior and creep recovery, and swelling behavior [2, 3].
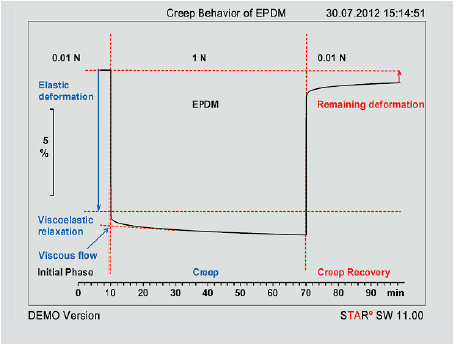
Figure 1. TMA curve showing the creep and creep recovery behavior of a rectangular EPDM sample (width 3.5 mm, length 3.5 mm, thickness 1.5 mm) measured at 30 °C.
Measurements and Results Thermomechanical analysis (TMA)
Isothermal creep and recovery
The term “creep” refers to the time- and temperature-dependent deformation of a material when it is subjected to a load or stress [4].
Creep deformation in polymers consists essentially of two components: reversible viscoelastic relaxation and irreversible viscous flow. The deformation due to viscoelastic relaxation recovers over time when the stress is reduced or removed.
Viscous flow however causes permanent deformation and geometry change. In an isothermal creep and recovery experiment, a constant mechanical stress (in this case, the force exerted by the TMA probe) is suddenly applied to the sample, held constant for a certain time, and then quickly removed.
The deformation (in this case the relative change in sample thickness) is recorded as a function of time and comprises three components: the initial almost instantaneous reversible elastic response, the slower viscoelastic relaxation, and the more or less constant viscous flow.
When the force is removed, the elastic response is immediately completely recovered whereas viscoelastic recovery takes longer.
The measurement curve does not return to the initial baseline. The difference is a measure of the irrecoverable viscous flow component. The elastic response is not considered as being part of creep deformation.
The curve in Figure 1 shows the elastic deformation, creep and recovery behavior of an EPDM elastomer measured at 30 °C. In the initial phase, the thickness of the sample was measured using a negligibly low force of 0.01 N. This was sufficient to ensure good contact between the TMA probe and the sample but low enough to exclude any sample deformation.
The force was then suddenly increased to 1 N. The resulting deformation consists of three components: the immediate elastic deformation and the time-dependent viscoelastic and viscous flow components...
Download the full text of this article below.
Summary
Parts 5 and 6 of this series of articles describe the different possibilities available for characterizing elastomers by DSC, TGA, TMA, and DMA (see Figure 8). EPDM and SBR are used as examples to illustrate some of the typical effects and applications that are important for elastomers. The main topics covered are the glass transition and its frequency dependence, vulcanization, compositional analysis, fillers/filler content and the effect of fillers, creep behavior and creep recovery, swelling in solvents, master curves and compatibility.
Different techniques provide different perspectives and can be used to characterize the same processes such as the glass transition, melting, and crystallization depending on the information required.
Thermal Analysis of Polymers. Part 6: TMA and DMA of Elastomers | Thermal Analysis Application No. UC361 | Application published in METTLER TOLEDO Thermal Analysis UserCom 36