Thermogravimetric and Calorimetric Analyses of Yeasts
Introduction
Flavors in foodstuffs are often volatile and can be lost during production or when the consumer prepares food products.
One possibility to reduce the loss of flavors during thermal processes (pasteurization, cooking) is to confine the volatile molecules in thermally stable particles such as empty yeast cells.
This article describes how we investigated the release of flavors encapsulated in yeast cells as a function of temperature. The measurements were performed using thermogravimetric analysis and differential scanning calorimetry. Interpretation of the measurement results provides a better understanding of the release mechanisms of the flavor molecules from the yeast cells.
Experimental Details
The yeast used for the experiments was Saccharomyces Cerevisiae (Firmenich SA, Item number 954794). The yeast was measured empty (unflavored) or loaded (flavored) with limonene (1-methyl-4- isopropenyl-1-cyclohexene). Limonene is a flavoring that smells strongly like oranges and occurs naturally in the peel of citrus fruits. The thermogravimetric measurements were performed using a METTLER TOLEDO TGA/SDTA851e under inert conditions (nitrogen) with sample masses of about 10 mg. The samples were heated in alumina crucibles from 25 to 400 °C at 20 K/min. The calorimetric measurements were performed using a METTLER TOLEDO DSC822e . The samples were also heated in alumina crucibles in a static air atmosphere from 25 to 400 °C at 20 K/min.
Results
Morphological Characterization of the Yeast
The morphology of the yeast cells with and without limonene was studied using transmission electron microscopy (TEM).
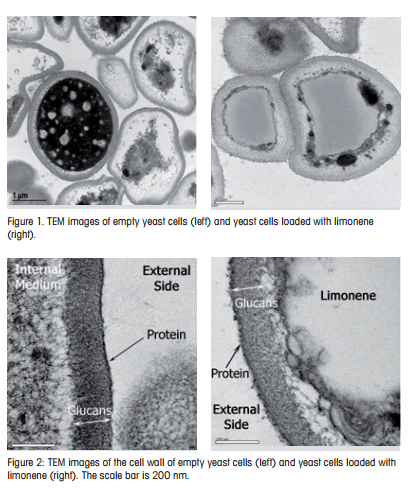
Typical images are shown in Figure 1. The yeast cells are spherical with a diameter slightly greater than 2 µm. The cell walls are clearly visible. The dark material in Figure 1 (left) is the cytoplasm of the cell. In loaded yeast cells (Figure 1, right), limonene has largely replaced the cytoplasm and occupies most of the internal volume of the yeast.
Figure 2 shows enlarged regions of the cell wall. This consists of glucans, mannoproteins and a small amount of chitin. The glucans form a rigid skeleton-like network that is filled with the mannoproteins. The mannoproteins maintain the porosity of the cell wall and shield it from external enzymatic attack (mannoprotein film on the external side of the cell wall).
Figure 2 shows detailed TEM images of a dead yeast cell. Replacement of the cytoplasm by limonene does not affect the structure of the cell wall to any extent. The cell membrane that separates the cytoplasm from the cell wall cannot be seen in the images
Thermal Stability
The thermal stability of the yeast (with and without limonene) was studied by TGA. The raw data is shown in Figure 3 (blue curve: yeast loaded with limonene, red curve: empty yeast cells). The curves can be divided into five different regions that can be interpreted as follows:
Region I: 25 to 110 °C. In this temperature region, both samples show a small mass loss. Karl Fischer titration showed that the loss of mass is due to the release of moisture (mainly from the cell walls).
Region II: 110 to 245 °C. The sample mass remains approximately constant. The cell walls are practically free of water, and only heating of the organic material occurs (yeast material with or without limonene).
Region III: 245 to 263 °C. The cells loaded with limonene show a large loss of mass due to the evaporation of limonene. The limonene is lost either through forced diffusion of gaseous limonene through a porous cell wall, or through mechanical rupture of the cell wall due to increased internal pressure caused by the increasing temperature.
Region IV: 263 to 293 °C. Both samples show a relatively rapid mass loss in this region.
This is interpreted as being due to cell wall rupture, which allows volatile compounds inherent to the yeast cells to escape.
Range V: 293 to 400 °C: The dry non-volatile constituents of the yeast cells undergo pyrolysis. The residue consists mainly of pure carbon. Figure 4 shows the normalized TGA data. The data was normalized so that the weight of the dry material at 293 °C was 100%. This presentation shows that both samples exhibit the same behavior from about 263 °C onward and can therefore be assumed to be similar in nature from that point on. The difference between the two curves lies in the loss of limonene, which occurs between 246 and 263 °C. Evaluation of the thermogravimetric measurements yields a limonene content of 26.7% w/w (see Figure 3), which is in good agreement with NMR results.
DSC Measurements
DSC measurements were performed with pure limonene, empty yeast cells, and yeast cells loaded with limonene (limonene content: 26.7% w/w).
 |
Conclusions
The thermal behavior of empty yeast cells and yeast cells loaded with limonene was studied by thermal analysis. The thermogravimetric data showed that the limonene did not vaporize and leave the yeast cells until temperatures above 246 °C. This means that limonene would remain in the food products up until this temperature during cooking. With the aid of DSC measurements, structural changes in the yeast cells loaded with limonene were detected. The results are illustrated in Figure 6.
Thermogravimetric and Calorimetric Analyses of Yeasts | Thermal Analysis Application No. UC 262 | Application published in METTLER TOLEDO Thermal Analysis UserCom 26