TTT Diagram: Determination from Postcuring Experiments
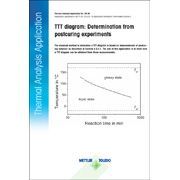 The classical method to determine a TTT diagram is based on measurements of postcuring behavior as described in Section 4.2.4.1. The aim of this application is to show how a TTT diagram can be obtained from these measurements.
| Handbook | | Page | | Keywords |
| Thermosets 2 | 53 | thermoset, curing, DSC, DDM, DGEBA, postcuring, TTT diagram, vitrification, induction period, isothermal curing, laminate, polyaddition, PUR, |
TGA of epichlorohydrin and halogenated butyl elastomers | Thermal Analysis Handbook HB 459 | Application published in METTLER TOLEDO TA Application Handbook Elastomers, Volume 2