Curve Interpretation, Part 3: DSC Curves and Curves from Other Thermal Analysis Techniques
In many practical analyses, one single DSC measurement is not enough to investigate the thermal behavior of a sample. More information can be obtained by performing additional measurements using thermal analysis techniques such as thermogravimetric analysis (TGA), thermomechanical analysis (TMA) or dynamic mechanical analysis (DMA). In this article, we will discuss several examples.
Introduction
DSC is a well-established method that is widely used in industry and research to obtain important information about materials with relatively little experimental time and effort. Sometimes uncertainties arise in the interpretation of the DSC measurement curves of a material.
For example, what exactly do the different steps and peaks mean? Additional information is then needed to interpret the results correctly and draw the right conclusions.
There are two main strategies:
- Perform additional DSC measurements with different experimental parameters for example using other heating and cooling conditions, temperature-modulated DSC (TOPEM®, ADSC), other gases, other crucibles, or crucibles sealed in different ways, etc.
- Carry out experiments using other thermal analysis techniques (TA), for example thermogravimetric analysis (TGA), thermomechanical analysis (TMA), dynamic mechanical analysis (DMA), Flash DSC, high-pressure DSC, or hot-stage microscopy.
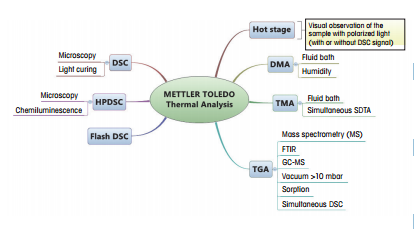
Various possibilities and examples of the first of the above two strategies have been described and discussed in previous UserCom articles [1, 2]. In this article, we want to show how the interpretation of DSC measurements can be improved through the use of other thermal analysis techniques. Figure 1 presents an overview of the thermal analysis techniques that METTLER TOLEDO currently offer.
When Are Other TA Techniques Recommended for the Interpretation of DSC Curves?
There are four situations in which another thermal analysis technique can aid the interpretation of DSC curves:
- If the sensitivity of the DSC is too low to measure certain effects. This is the case for example with glass transitions.
- If the sample is not stable.
- If the DSC curve shows effects that cannot definitely be assigned to particular processes.
- If the DSC is not the right technique to answer a certain question. An example of this is the determination of the gel point. The gel point occurs in curing reactions and corresponds to the degree of cure at which a resin undergoing reaction changes from the "liquid" to the "solid" state. With thermal analysis techniques, this can only be determined by DMA or TMA
Case 1: The DSC is not sensitive enough
Glass transitions can be measured by DSC, by thermomechanical analysis (TMA), and by dynamic mechanical analysis (DMA).
Figure 2 displays the physically most important quantities that can be determined using these three techniques for the glass transition of polystyrene. The measurement curves can be used to estimate the relative sensitivity of the three methods.
The top diagram shows the specific heat capacity curve of polystyrene. In this, the glass transition is observed as a steplike increase in the specific heat capacity between 80 and 100 °C. The increase is about 0.35 J/(g K) or about 25% with respect to the specific heat capacity in the glassy state.
During the glass transition, the thermal expansion coefficient (CTE) and the modulus (G’) also change. The change in the expansion coefficient can be determined by TMA. The TMA curve in the middle diagram shows that the CTE increases from about 100 ppm in the glassy state to about 350 ppm in the rubbery plateau. This corresponds to a relative increase of 350%.
The DMA curve in the bottom diagram shows that the shear modulus of polystyrene decreases from about 1700 MPa to just a few 100 kPa, that is, by several decades, during the glass transition. The example illustrates the fact that DMA detects glass transitions with much higher sensitivity than DSC or TMA. Carbon-fiber-reinforced epoxy resins are nowadays used for many technical applications. The materials have mechanical properties that are equally good as those of metals but have a much lower weight. They are therefore widely used in the automobile and aerospace industries. An important question is the temperature range in which they can be used and hence the glass transition temperature of the materials.
The upper diagram in Figure 3 displays the DSC curve of a carbon-fiber-reinforced epoxy resin. The exothermic increase of the heat flow above about 200 °C indicates that the material begins to decompose at this temperature. The glass transition temperature of the material is not apparent.
The lower diagram in Figure 3 displays the results of a DMA measurement. The sample (thickness 0.42 mm, cross-sectional area 4.3 mm2 ) was measured in the shear mode at 1 Hz.
The curves of the two components of the shear modulus are displayed for the first heating run. The storage modulus (G') curve exhibits a step-like decrease at about 206 °C. The loss modulus (G'') curve shows a peak at about 222 °C. This behavior is typical for a glass transition. It is also noticeable that the storage modulus increases after the glass transition. This is due to postcuring of the material.
Neither the glass transition nor the postcuring reaction of the material can be identified by DSC. The DMA technique is therefore much better than DSC for determining the glass transition temperature of highly filled carbon-fiber-reinforced resins.
Case 2: The sample is not stable
In this example, the melting behavior of an active pharmaceutical ingredient (API) was investigated using a heating-cooling-heating experiment. The results are displayed in Figure 4.
The first heating run (black curve) shows three endothermic peaks. In the cooling run (blue curve) and the second heating run (red curve), no clearly recognizable thermal events occur in the temperature range investigated. After the measurement, the sample was present as a viscous liquid that had lost 5.4% of its initial mass and was slightly colored. The sample was clearly unstable. The question is, however, what are the three peaks observed in the first heating run?

Conclusion
One single measurement is often not enough to investigate the thermal behavior of a sample by DSC. A better understanding of the processes occurring in a sample can be obtained by varying the measurement methodology and using other thermal analysis techniques.
To literally see what happens to a sample, DSC measurements are often complemented with experiments involving the use of a DSC microscope or a heating stage.
TGA, possibly combined with suitable evolved gas analysis techniques (MS, FTIR, GC/MS) provides valuable additional information for unstable samples or samples that decompose. DMA and TMA can be used to measure effects that cannot be detected by DSC in cases where the sensitivity of the DSC is not sufficient.
Curve Interpretation, Part 3: DSC Curves and Curves from Other Thermal Analysis Techniques | Thermal Analysis Application No. UC 401 | Application published in METTLER TOLEDO Thermal Analysis UserCom 40