Thermal Analysis of Polymers. Part 3: DSC of Thermosets
Parts 1 and 2 of this series of articles were published in UserCom 31 [1] and 32 [2] and explained how DSC, TGA, TMA and DMA techniques can be used to investigate thermoplastics. Parts 3 and 4 describe experiments performed on a different type of plastic, namely on thermosetting materials or simply thermosets. This article presents a number of DSC applications. Part 4 will appear in UserCom 34 and will discuss the results obtained using TGA, TMA and DMA techniques. The main effects described in this article are the glass transition and specific heat capacity, curing reactions and kinetics, thermal history, temperature- modulated DSC (ADSC).
Introduction
Thermal analysis encompasses a number of techniques that are used to measure the physical properties of a substance as a function of time while the substance is subjected to a controlled temperature program. The techniques include differential scanning calorimetry (DSC), thermogravimetric analysis (TGA), thermomechanical analysis (TMA), and dynamic mechanical analysis (DMA).
Thermal analysis is employed in research and development, process optimization, quality control, material failure and damage analysis as well as to investigate competitive products. Typical applications include making predictions about the curing behavior of products, testing the compatibility of composite materials or investigating the frequency dependence of the glass transition.
KU600
The well-known product KU600 is based on an epoxy resin and a catalyst. It is a good example of a powder coating material for electrical and electronic components. It is used to insulate metal components or as a protective coating for ceramic condensers.
It provides good adhesion to substrates, an excellent combination of mechanical, electrical and thermal properties, and very good resistance to chemicals.
Experimental Details
The analytical techniques used in Parts 3 and 4 were DSC, TGA, TMA and DMA. The following instruments were employed: DSC 1 with FRS5 sensor, TGA/DSC 1 with DSC sensor, TMA/SDTA840e , and DMA/ SDTA861e . The results were evaluated using the STARe software. KU600 as a single component powder was used for all measurements without any special sample preparation.
Differential Scanning Calorimetry (DSC)
Main effects
DSC is used to measure the heat flow to or from a sample as a function of temperature or time. The technique can quantitatively analyze both physical transitions and chemical reactions [3].
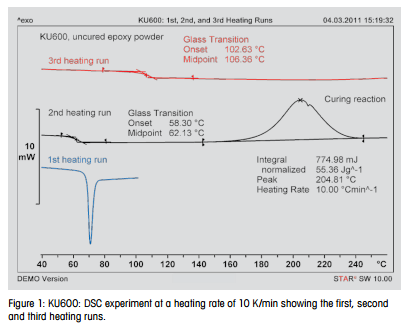
Figure 1 shows the basic effects that are observed when an initially uncured thermoset is measured by DSC. The figure displays three heating runs. The first heating run (blue) was stopped at 100 °C and shows the glass transition accompanied by enthalpy relaxation. The latter occurs when the sample is stored for a longer period below the glass transition temperature. It has to do with physical aging of the material.
The first heating run eliminates the thermal history of the sample. The second heating run shows the glass transition followed by a large exothermic reaction peak that characterizes the curing of the epoxy resin. A small endothermic peak can be seen at about 210 °C in the middle of the exothermic curing peak. This is caused by the melting of an additive (dicyandiamide) in the KU600.
The third heating run looks completely different. The material has obviously undergone a drastic change. Initially, the sample was present as a powder. This coalesced and cured during the second heating run to form a solid crosslinked material that exhibits different properties. In particular, the third heating run shows that the glass transition has shifted to higher temperature and that no further exothermic reaction occurs.
Figure 2 summarizes the results obtained when KU600 was stored isothermally for different times at 150 °C and then measured in dynamic DSC experiments. In each case, first and second heating runs were performed. The results show that the glass transition temperature clearly depends on the degree of cure. The higher the degree of cure, the more the glass transition shifts to higher temperature. The first heating run also shows that the area of the postcuring reaction peak decreases with increasing degree of cure. Completely cured material shows no postcuring at all [4].
Thermal history
Figure 3 shows the effect of different cooling rates on the glass transition. Cured KU600 was first cooled at different rates and the effect on the glass transition measured in subsequent heating runs at 10 K/min. Low cooling rates have the same effect as long annealing times below the glass transition temperature. The lower the cooling rate, the larger the enthalpy relaxation effect. The enthalpy relaxation can therefore be used to check whether the process or storage conditions remain the same.

Summary
Comparison of the reversing and non-reversing curves shows quite clearly that the endothermic peak of the enthalpy relaxation is on the non-reversing curve and the glass transition on the reversing curve. Besides this, we can calculate the specific heat capacity curve from the reversing curve This however depends on the measurement frequency chosen.
The ADSC measurement thus makes it very easy to separate the effects that overlap on the normal DSC curve by splitting the total heat flow into reversing and non-reversing components. A typical reversing effect is for example the glass transition whereas non-reversing effects may be due to enthalpy relaxation, vaporization, a chemical reaction or crystallization.
Part 4 of this series of articles will be published in UserCom 34 and will describe TGA, TMA and DMA measurements.
Thermal Analysis of Polymers. Part 3: DSC of Thermosets | Thermal Analysis Application No. UC 331 | Application published in METTLER TOLEDO Thermal Analysis UserCom 33