Determination of Phase Transitions with Simultaneous Video Observation
The melting point is without doubt the thermal value most frequently used to characterize materials. This fact together with ever-increasing requirements for melting point determination were the two main reasons why METTLER TOLEDO decided to develop a completely new series of instruments.
The new Excellence Melting Point Systems allow substances to be analyzed that could previously not be measured by conventional melting point instruments. The following article presents a number of different examples.
Introduction
The Melting Point
The melting point is a characteristic property of a substance. It is the temperature at which the crystalline phase changes to the liquid state. A pure substance normally has a sharp melting point, whereas an impure substance melts over a temperature range that is lower than the melting point of the pure substance. This effect is well known and called the melting point depression. Some organic compounds melt and decompose simultaneously. This makes it difficult to determine an exact melting point. Melting can also occur over a relatively wide temperature range. One then refers to a melting range rather than a melting point. This effect is especially observed with polymers.
In general, melting point determination is used in research and development as well as in quality control to identify and check the purity of substances.
Melting Point Detection
Many materials are opaque in the crystalline state but transparent in the liquid state. This change in optical properties during melting can be used to determine the melting point or melting range. The measurement is performed by heating the sample in a furnace at a constant rate and continuously measuring the intensity of light transmitted through the sample (i.e. the transmittance). When the transmittance exceeds a predefined value, the sample is said to have melted.
This well-proven principle is also employed in the new METTLER TOLEDO melting point instruments.
The new instruments use a camera as a detector to measure the light intensity of the sample and LEDs as the light source. LEDs offer advantages such as lower energy consumption and longer lifetime and at the same time generate more homogeneous light.
The large display incorporated in the instrument allows several observers to follow the melting process. Two models, the MP70 and MP90, permit videos to be transferred via SD card to the computer and archived. The video format is AVI. This means that you can replay videos on the computer with commercially available software. Likewise, the experiment data and intensity curves stored on the SD card as an ASCII text file can also be archived if desired. The file can be opened and processed in a spread sheet such as Microsoft Excel.
The instruments simultaneously determine up to four (MP50 and MP70) or six samples (MP90).
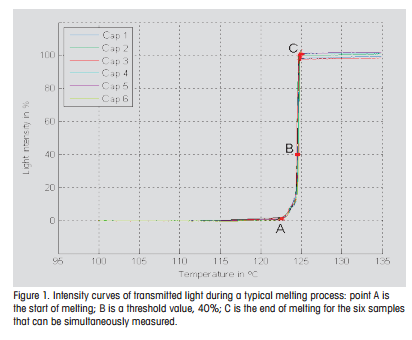
Figure 1 shows typical light intensity curves measured during a typical melting process. Three points, labeled A, B, and C, are marked on the curve. These points are characteristic temperatures determined in a melting point analysis. Point A marks the start of melting, point B a characteristic temperature at which the transmittance reaches a certain value, and point C the end of melting. For the melting point determination, either point B or point C is used. Most standards define the end of melting (point C) as the melting point. Point C can also be automatically evaluated by the new melting point systems. Points A and C are used to determine the melting range.
Visual Observation
Standards that govern the determination of melting point, such as USP <741> or Ph. EUR 2.2.14, require visual observation of the sample.
This is done using the built-in camera system. However, the possibilities offered by the new melting point systems go much further. Previously, you had to sit in front of the melting point apparatus during the measurement and observe the samples through a lens. If you missed the melting point, you had no choice but to prepare a new sample and repeat the measurement. In the new instruments, the melting process is stored as a video. You can replay the video as many times as you wish.
Figure 2 displays different images from such a video. The left image shows the sample as a white powder in the capillary at the beginning of a measurement. During melting, the sample consists of a mixture of liquid and solid crystals. The liquid forms a column with a meniscus at the top. This point is called the meniscus point and is shown in the middle image. Finally, as the temperature increases, the remaining crystals melt and the contents of the capillaries are completely clear. This is the case at point C in Figure 1 and at higher temperatures (right image).
Experimental Details
An experiment begins with sample preparation. First, the dry substances are finely ground and filled into capillaries. The furnace of the instrument can accommodate capillaries with diameters of up to 1.8 mm.
 |
Summary
The new melting point systems offer many advantages such as:
- High-resolution touchscreen for optimal display of videos, intensity curves and results
- Ease of use including One Click™ short cut keys
- Video recording in reflection coupled with well-proven automatic measurement in transmission
- High throughput analysis for the simultaneous measurement of up to four or six samples
- Manual setting of up to two points
- Automatic endpoint detection, pharmacopeia mode, and the size of capillaries ensure compliance with all current standards
- Video replay on the instrument
- AVI video and experiment data export via SD card
- Statistical evaluation of the results of a measurement
These functionalities and many other features enable the user to quickly obtain valuable information about the melting behavior of different materials. Detailed IQ/OQ documents are available for all instruments. If required, a METTLER TOLEDO service engineer will help you with IQ/OQ.
Determination of Phase Transitions with Simultaneous Video Observation | Thermal Analysis Application No. UC 292 | Application published in METTLER TOLEDO Thermal Analysis UserCom 29