Melting Behavior and Decomposition, Aspartame
Sample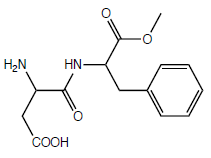
Aspartame
Application
Inactive ingredient (sweetening agent)
Conditions
Measuring cells: DSC820, TGA850, F82 Hot stage microscope
Pans: DSC, TGA: Aluminum 100 µl, with pierced lid; FP82: sample holder with cover glass
Sample preparation: As received, no preparation
DSC measurement: Heating from 40 °C to 300 °C at 10 K/min
TGA measurement: Heating from 30 °C to 300 °C at 10 K/min
FP82 measurement: Start at 30 °C, heating at 10 K/min
Atmosphere: DSC and TGA: Nitrogen 80 cm3/min, FP82: Air, stationary environment, no flow
Interpretation
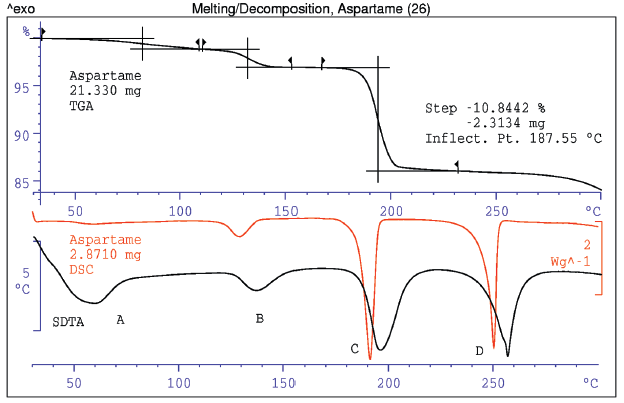
In the TGA curve the substance shows several weight loss steps. The SDTA signal recorded at the same time shows that all the reactions are endothermic. The DSC curve also gives the same information. The peaks are however sharper than in the SDTA signal because of the shorter time constant.
A slow but continuous weight reduction caused by the loss of moisture can be observed in the region between 40 °C and 110 °C. The step at about 129 °C is the elimination of the water of crystallization. This is confirmed by simultaneous measurements with the mass spectrometer. Finally, at about 187 °C, the substance decomposes by elimination of methanol (m/e = 31). The peak that can be observed at 245.7 °C in the DSC and SDTA curves corresponds to the melting of the decomposition product (3-carboxymethyl-6-benzyl-2.5-dioxopiperazine).
Evaluation
Onset temperature determination and integration of the melting peak of the DSC curve.
Peak | SDTA Onset, °C | DSC Onset, °C | DSC ΔH, J/g |
Effect |
|---|---|---|---|---|
| A | 40.0 | - | - | moisture |
| B | 122.3 | 122.7 | 29.8 | water of crystallization |
| C | 183.6 | 185.4 | 141.4 | decomposition |
| D | 239.4 | 245.7 | 121.3 | melting of the decomposition product |
Step | TGA Eval. Range, °C | TGA Onset, °C | TGA Step, % |
Effect |
|---|---|---|---|---|
| A | 30-110 | 79.6 | 1.1 | moisture |
| B | 110-150 | 123.6 | 1.9 | water of crystallization |
| C | 180-225 | 184.1 | 10.8 | decomposition |
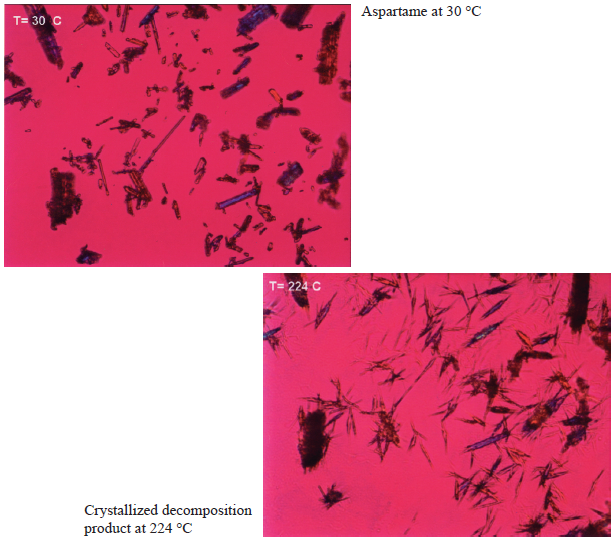
Additional information obtained with the hot stage microscope shows how the crystal structure of aspartame changes with temperature. To illustrate this, photographs were taken during the heating run at 30 °C and 224 °C. It can be clearly seen at 224 °C that fine needles are formed which correspond to the decomposition product.
Conclusion
For the elucidation of thermal behavior, the combination of TGA and DSC results with thermomicroscopy is often useful for the correct interpretation of complicated curves.
Melting Behavior and Decomposition, Aspartame | Thermal Analysis Application No. HB821 | Application published in METTLER TOLEDO TA Application Handbook Pharmaceuticals