Analysis of a BR/NR Elastomer by TGA-FTIR
Purpose
To analyze the individual polymer constituents of an elastomer.
Sample
Technical elastomer
Conditions
Measuring cell: TGA/SDTA851e connected to a Nicolet Nexus FTIR spectrometer with a heated transfer line.
Pan: Alumina 70 µl
TGA measurement: Heating from 50 °C to 900 °C at 10 K/min
Atmosphere: Nitrogen, 50 ml/min
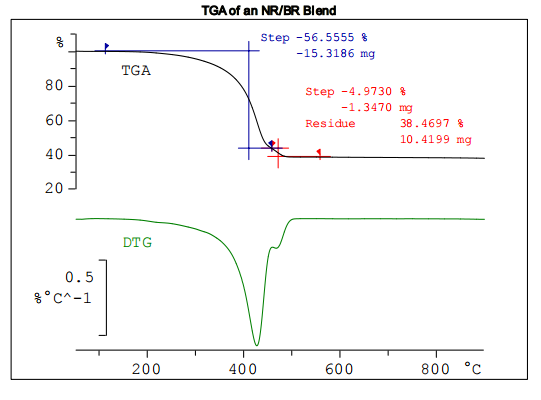
The diagram displays the TGA and DTG curves of the sample
Evaluation
The TGA curve shows a two-step pyrolysis reaction. The step height of the first step is 56.6% with a DTG peak maximum at about 420 °C; the second step height is much smaller, 5.0%, with a DTG maximum at 465 °C. After pyrolysis, a residue of 38.5% remains. This consists of various inorganic constituents and carbon black. Infrared spectra of the evolved gases were continously recorded throughout the TGA measurement in order to identify the polymers concerned. The IR spectra recorded at the DTG peak maxima were used for identification purposes:
Interpretation
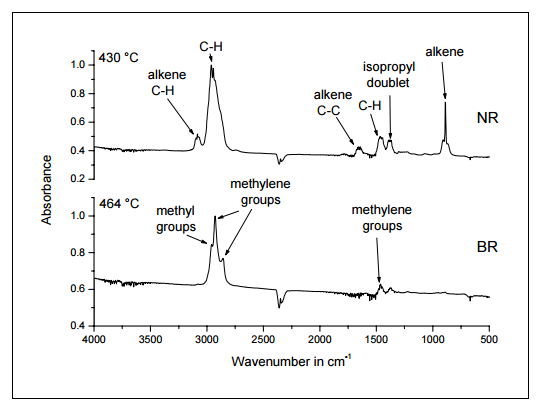
The IR spectrum at 430 °C characterizes the gases evolved during the first pyrolysis step.
The bands just below 3000 cm-1 (2960 m-1 and 2930 cm-1 ) are characteristic for the methyl group and are due to C-H (aliphatic) stretching vibrations. The corresponding deformation vibrations can also be seen at 1460 cm-1. The bands at 3080 cm-1 and 1650 cm-1 are characteristic for the presence an alkene group (carbon-carbon double bond). The band at 3080 cm-1 is due to the C-H (unsaturated) stretching vibration, and that at 1650 cm-1 arises from the C=C stretching vibration. The band at 890 cm-1 is a C-H deformation vibration characteristic for alkene groups.
The double in the range 1380-1360 cm-1 is a C-H deformation vibration that indicates the presence of an isopropyl group. The absorption spectrum is typical for NR.
The pyrolysis products of the second polymer are characterized by the IR spectrum measured at 464 °C. The bands at 2920 cm-1 , 2850 cm-1 and 1450 cm-1 are due to C-H stretching and deformation vibrations of methylene groups of the type R-CH2-R. The band at 2950 cm-1 is caused by the methyl group. This spectrum is typical for long chain alkanes formed during the pyrolysis of BR.
Conclusions
TGA-FTIR allows the polymer constituents of a sample to be analyzed. TGA analysis yields quantitative data relating to the composition of the elastomer whereas the IR spectra identify the decomposition products and through this the individual polymers involved.
The composition of the elastomer sample was found to be about 56.6% NR and 5.0% BR.
Analysis of a BR/NR Elastomer by TGA-FTIR | Thermal Analysis Application No. HB 470 | Application published in METTLER TOLEDO TA Application Handbook Elastomers Volume 2