TTT Diagram: Application of Temperature-Modulated DSC
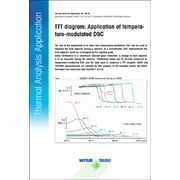 The aim of the application is to show how temperature-modulated DSC can be used to measure the heat capacity during a reaction. In a conventional DSC measurement the heat capacity would be overlapped by the reaction peak.
Since vitrification is a chemically induced glass transition, a change in heat capacity is to be expected during the reaction. Vitrification times can be directly measured by temperature modulated DSC and the data used to construct a TTT diagram. ADSC and TOPEM® measurements are suitable for this purpose. In the example shown, the ADSC technique was used (see also Section 4.2.4.2).
| Handbook | | Page | | Keywords |
| Thermosets 2 | 55 | thermoset, curing, DSC, ADSC, conversion curve, isothermal curing, temperature-modulated DSC, TOPEM®, coatings, heat capacity, lacquer, softening, softening temperature, TTT diagram, vitrification, modulated DSC, oscillating DSC |
TTT diagram: Application of temperature-modulated DSC | Thermal Analysis Application No. HB 47 | Application published in METTLER TOLEDO TA Application Handbook Thermosets Volume2