Databases as an Aid for the Interpretation of DSC Curves
Databases for the interpretation of measurement data are nowadays widely employed in analytical chemistry. In thermal analysis, however, this possibility has hardly been used for the interpretation of measurement curves. In the following article, we present a database in which DSC curves, characteristic values, and FTIR spectra of more than 600 commercially available materials are stored. The data describes about 120 different types of polymers.
Introduction
In many analytical techniques, for example infrared spectroscopy or GC/MS, the interpretation of the measured spectra and hence the identification of substances is performed using databases. The interpretation of DSC curves with the aid of reference curves or characteristic values (such as the glass transition temperature or the melting point and the enthalpy of melting) is much more difficult because both the shape of a measured DSC curve and the characteristic values evaluated depend on the heating rate, the sample mass and the thermal history of the sample. This makes the use of databases for the identification of unknown polymers difficult.
Despite this, databases in which characteristic values and DSC reference curves are stored can be of help for the interpretation of DSC measurements. In the last few years, we have developed a database of this type at the Polymer Institute in Lüdenscheid..
Besides characteristic values, the database also includes DSC curves of different types of polymers measured under standard conditions; the corresponding IR spectra are also stored for each material.
The following sections describe examples showing the identification of polymers by means of DSC curves, characteristic values and IR spectra.
Example 1: Differentiation of Polyamide 6 and Polyamide 610
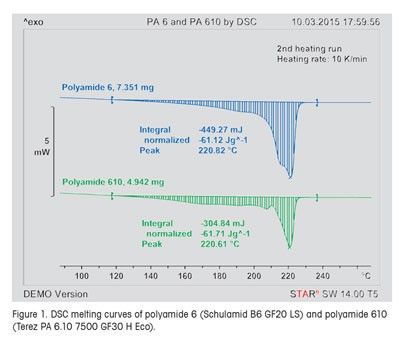
Clearly, DSC curves contain more information than just a few characteristic values. This is shown by the example in Figure 1 which displays the DSC curves of samples of polyamide 6 (Schulamid B6 GF20 LS, blue curve) and polyamide 610 (Terez PA 6.10 7500 GF30 H Eco, green curve). On the basis of the values of the peak temperature of the main peak and the enthalpy of melting, the two materials could be considered identical.
In contrast, the DSC measurement curves exhibit important differences: For example, the polyamide 610 curve shows a small melting peak that is clearly separated from the main peak. The polyamide 6 curve, however, displays two clear shoulders in the melting peak. On the basis of the DSC curves, the two polyamides can be clearly differentiated.
Example 2: Differentiation of Polyamide 6 and Polyamide 66
Fourier transform infrared spectroscopy (FTIR) is also often used for the rapid identification of polymers. However, identification using FTIR spectra is sometimes difficult, especially with polyamides and polyesters.
This is illustrated in Figure 2, which displays the FTIR spectra of polyamide 6 (blue) and polyamide 66 (red). The two spectra appear practically identical; the two different materials cannot be identified by FTIR without expert knowledge.
The two polyamides can however easily be distinguished by DSC due to their different melting behavior (polyamide 66 melts at a higher temperature) as shown in Figure 3.
Example 3: Differentiation of Filled and Unfilled Polypropylene
The FTIR spectrum of a filled material also includes the spectrum of the filler. An example of this is shown in Figure 4, which displays the spectra of unfilled polypropylene and polypropylene containing 20% talc (magnesium silicate hydrate) as filler. Absorption bands characteristic for talc are clearly visible at about 1000 cm-1.
The bands characteristic for polypropylene are in good agreement. The DSC curves displayed in Figure 5 show the influence of talc on the melting behavior of the material. Evaluation of the enthalpies of melting yielded an estimated talc content of 20%. Exact quantification is however not possible because other factors influence the enthalpy of melting.
Example 4: Differentiation of Polyamide 6 and Polybutylene Terephthalate
When trying to identify unknown polymers, one should be aware that the peak position and the intensity of the melting points of some polymers are very similar. For example, in Figure 6 the DSC curves of samples of polyamide 6 and polybutylene terephthalate hardly differ in their position, peak shape, and enthalpy of melting. In this case, comparison of the infrared spectra shown in Figure 7 helps us to identify the materials. The differences between the two spectra are readily apparent and the two polymers can easily be identified using the database.

Conclusions
For many techniques, databases are nowadays an indispensable aid for the interpretation of measurement results. In thermal analysis, databases have not been used to the same extent.
The reason for this is the fact that the measurement curves strongly depend on the experimental conditions (e.g. heating rate, sample mass) and the thermal history of the sample. Nevertheless, a suitable database can be of great help for the interpretation of DSC curves, for example in the polymer field.
At the Kunststoff Institut in Lüdenscheid, we have developed a database of this type. Besides characteristic values such as melting points, the database includes DSC curves of different polymers measured under standard conditions. In addition, the corresponding FTIR spectra are also stored for each material.
Databases as an Aid for the Interpretation of DSC Curves | Thermal Analysis Application No. UC 424 | Application published in METTLER TOLEDO Thermal Analysis UserCom 42