Investigation of the Temperature Stability of Polymer Additives and their Decomposition Products by TGA-MS and TGA-FTIR
Introduction
The processing of plastics and their additives puts high demands on temperature accuracy in the various processing steps as well as on temperature homogeneity within the material being processed. Because of the typically long processing times at high temperatures, there is always the possibility that products begin to decompose during production. In this particular case, an unpleasant smell was noticed during the processing of a plastic. A sample was analyzed by TGA followed by evolved gas analysis in order to measure the temperature range in which decomposition occurred and to identify the volatile compounds produced. The gaseous products were first analyzed using a mass spectrometer (MS) and then later with a Fourier transform infrared spectrometer (FTIR).
These two techniques allow volatile decomposition compounds and gaseous elimination products to be characterized and in some cases identified. The following example describes the identification of ammonia as a decomposition product. It demonstrates the power of such combined methods and their importance for product development in an early phase of research
Experimental Details
TGA-MS measurements were performed using a large-furnace TGA/SDTA851e connected online to an Inficon Thermostar mass spectrometer. The sample was heated from 30 °C to 400 °C at 10 K/min. A 900-µl alumina crucible with pierced lid was used in order to measure as much sample as possible. The purge gas was argon (90 mL/min). In a preliminary experiment, the ion masses in the range 10 < m/z < 150 were analyzed. Based on the results of this experiment, ions of several different m/z values were selected and their intensities individually monitored in a second experiment (multiple ion detection, MID). The MS ion intensities recorded were m/z 15, 16, 17, 18, which are characteristic for water and ammonia. TGA-FTIR measurements were performed using a large-furnace TGA/SDTA851e connected online to a Nicolet Nexus FTIR spectrometer. The purge gas was nitrogen (50 mL/min). Once again, the samples were heated in a 900-µL alumina crucible with pierced lid. Infrared (IR) spectra were continuously scanned at a resolution of 4 cm-1 and 16 successive scans repeatedly averaged.
Discussion of the TGA-MS Results
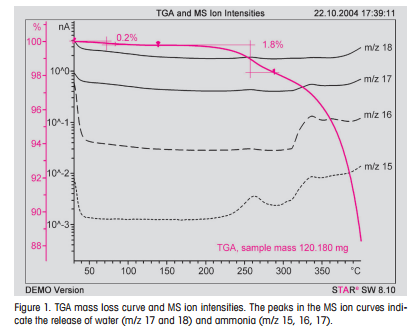
Up until 400 °C, three mass loss steps can be identified in the TGA curve (Fig. 1). Between 50 and 150 °C, the m/z 17 and 18 ion intensities indicate the presence of traces of water. Evaluation of the TGA curve yields a mass loss of about 0.2%. During the second mass loss step (1.8%), peaks are observed in the m/z 15, 16, 17, 18 ion curves. These peaks indicate the release of water (m/z 17 and 18) as well as ammonia (m/z 15, 16, 17). The overlap of the fragment ions of water and ammonia make the interpretation of the mass spectra rather difficult.
Discussion of the TGA-FTIR Results
The TGA results of the TGA-FTIR analysis are of course the same as those obtained using TGA-MS. The TGA-FTIR technique generates a large number of FTIR spectra. These are usually processed by calculating a so-called GramSchmidt (GS) curve. This is obtained through automatic integration of the infrared absorption of each spectrum over the entire wavenumber range. The Gram-Schmidt curve corresponds to the IR absorption intensity of the gaseous products arriving in the heated cell from the TGA as a function of sample temperature (or time) and is therefore directly related to the concentration of these decomposition products. Figure 2 shows the TGA and DTG (first derivative) curves together with the Gram-Schmidt curve. Two mass loss steps at 250 °C and 390 °C can be identified in the TGA curve (the mass-loss step at about 60 °C due to moisture in the TGA-MS measurement cannot be seen with the ordinate scale used).
In principle, the FTIR spectra corresponding to these temperatures could be recalled and interpreted in order to identify the gases that were in fact evolved. Spectral interpretation, however, requires considerable experience and presupposes ideas about the composition of the gas mixture. A simpler approach is to continuously integrate certain wavenumber ranges and display the signal as a function of time or temperature. The resulting curves are known as chemigrams. The wavenumber ranges chosen are those characteristic for certain compounds or for particular functional groups in possible compounds. Chemigrams simplify the task of processing the complex IR spectra obtained from gas mixtures.
 |
Conclusions
TGA provides quantitative information on the mass changes of a sample as a function of temperature. The processes that occur can only be completely understood if qualitative information about the evolved decomposition products is available. This information can be obtained by connecting the TGA online to a gas analyzer such as a mass spectrometer (MS) or an FTIR spectrometer (FTIR).
In this case, MS and FTIR analysis of the gaseous decomposition products indicated that emission of ammonia can be expected at sample temperatures above about 200 °C. In addition, the analysis showed that ammonia is evolved in three steps. The results obtained from the FTIR measurements are consistent with those obtained from the MS analysis. However, based on the MS data alone, it would have been more difficult to identify the three-step emission process of ammonia. Care must however be exercised when using chemigrams because other compounds can have absorption bands in the same wave-number region. In many cases, therefore, the precise nature of compounds evolved in decomposition processes can only be characterized through the combination of both MS and FTIR data.
TGA-FTIR is particularly suitable for detecting small molecules that are difficult to interpret by MS.
Investigation of the Temperature Stability of Polymer Additives and their Decomposition Products by TGA-MS and TGA-FTIR | Thermal Analysis Application No. UC 214 | Application published in METTLER TOLEDO Thermal Analysis UserCom 21