Two-Component Phase Diagram and the Determination of the Eutectic Composition of Dimethyl Terephthalate (DMT) And Benzoic Acid
This article uses the system dimethyl terephthalate (DMT) and benzoic acid as an example to illustrate how the two-component phase diagram of a eutectic system can be determined by DSC measurements.
As expected, the eutectic always melts at the same temperature. The heat of fusion of the eutectic peak is however different due to the different sample compositions.
The plot of the heats of fusion of the eutectic peaks against sample composition yields the eutectic composition. The two-component phase diagram can then be plotted from the melting points of the peaks.
Introduction
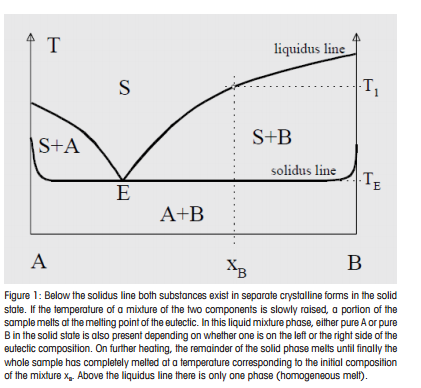
The regions in which the various phases of a binary mixture are in equilibrium can be described by a so-called two-component phase diagram in which the temperature is plotted as a function of composition. The term eutectic melting diagram is also used if we are dealing with solid-liquid transitions. There are in fact 12 different basic types of two-component melting diagrams (see for example [1]). In practice, however, we often encounter eutectic systems whose two-component phase diagrams are of the type shown schematically in Figure 1.
Two-Component Phase Diagrams from DSC Measurements
These types of two-component phase diagrams can be determined by DSC measurements. To do this, samples containing mixtures of the two substances in different ratios are prepared and measured by DSC. Points on the liquidus line are determined by measuring the clear melting points of the different samples and plotting these as a function of the composition of the sample. The clear melting point (the temperature at which melting is complete) corresponds approximately to the temperature of the maximum of the second peak, i.e. the melting peak of the pure (main) component.

Results
This method is illustrated in Figures 2 to 4 using the system dimethyl terephthalate (DMT) and benzoic acid as an example. Figure 2 shows the DSC curves for various mixtures with different ratios of DMT and benzoic acid. As expected, the eutectic always melts at the same temperature. The heat of fusion of the eutectic peak is however different in each case because of the different sample compositions. The plot of the heats of fusion of the eutectic peaks against sample composition (Fig. 3) yields a value of 72 mol% for the eutectic composition. The two-component phase diagram of DMT and benzoic acid can then be plotted from the melting points of the peaks (see Fig. 4).
Two-Component Phase Diagram and the Determination of the Eutectic Composition of Dimethyl Terephthalate (DMT) And Benzoic Acid | Thermal Analysis Application No. UC 108 | Application published in METTLER TOLEDO Thermal Analysis UserCom 10