Influence of Thermal History and the Evaluation of the Glass Transition, Polystyrene
Sample
Polystyrene
Application
As a standard for Tg determination
Conditions
Measuring cell: DSC820
Pan: Aluminum 40 µl, hermetically sealed
Sample preparation: One small flat piece
DSC measurement: Heating from 25 °C to 140 °C at 20 K/min
Atmosphere: Nitrogen, 50 cm3/min
Interpretation
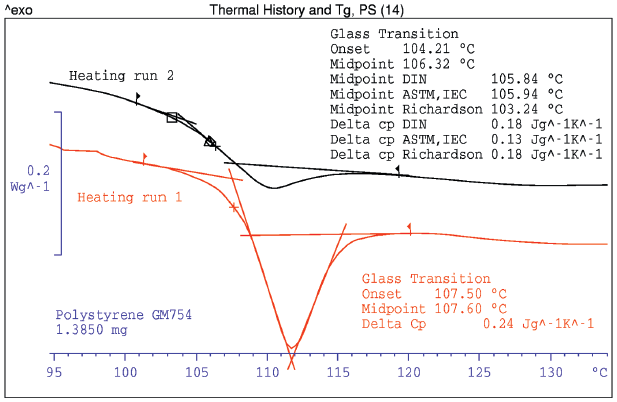
In the first heating curve the glass transition can hardly be seen because of the large relaxation peak. In the second heating curve the relaxation effect is weak and the glass transition can be measured. The value given for the glass transition temperature depends of course on the evaluation method used.
Evaluation
The glass transition is evaluated according to different methods. The onset temperatures and the midpoints are determined and given below.
| Result | Onset | Midpt. | Midpt. DIN | Midpt. ASTM | Midpt. Richardson |
|---|---|---|---|---|---|
| Heating run 1 | 107.5 °C | 107.6 °C | - | - | - |
| Heating run 2 | 104.2 °C | 106.3 °C | 105.8 °C | 105.9 °C | 103.2 °C |
+ Intercept of the DSC curve and the bisector of the angle formed by the extrapolation of the baselines before and after the transition (STARe)
♢ Midpoint of the segment of the inflectional tangent between the onset an the Endpoint (ASTM/IEC)
Δ Midpoint of the segment of the Mid tangent between the extrapolated baselines (DIN51007)
☐ Intersecting point of the enthalpy temperature function according to Richardson
![]()
Diagram showing the evaluation of glass transition according to different methods.
Conclusion
In order to determine the actual glass transition temperature of amorphous materials the thermal history must be eliminated by performing two heating runs on the same sample. Since different evaluation methods can give different results, it is important to give details of the method used.
Influence of Thermal History and the Evaluation of the Glass Transition, Polystyrene | Thermal Analysis Application No. HB818 | Application published in METTLER TOLEDO TA Application Handbook Pharmaceuticals