Characterization of the Melting Behavior, Vanillin
Sample
Vanillin
Application
Flavoring agent
Conditions
Measuring cells: DSC820 or TGA850
Pan: Aluminum 40 µl, with pierced lid or open
Sample preparation: As received, no preparation
DSC measurement: Heating from 30 °C to 250 °C at 10 K/min
TGA measurement: Heating from 30 °C to 250 °C at 10 K/min, blank curve corrected
Atmosphere: Nitrogen, DSC: 50 cm3/min, TGA: 20 cm3/min
Interpretation
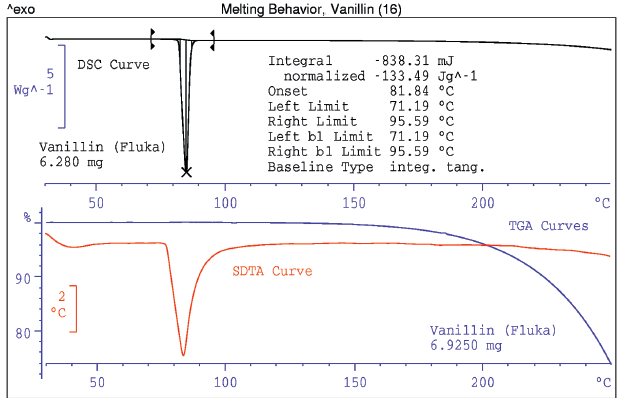
The melting curve provides a survey of possible events that can occur during the measurement. This information can not be gained from simple melting point determinations with TOA. For instance the DSC curve shows a slight shift of the baseline after the melting process. The TGA curve shows no weight loss in this region, which indicates that the DSC baseline shift is caused by a change in the specific heat capacity (cp). The SDTA signal of the TGA850 allows a qualitative evaluation of the melting behavior along with the TGA measurement.
An increasing weight loss occurs at temperatures above 150 °C because the vanillin evaporates and decomposes.
Evaluation
Onset temperature determination and integration of the melting peak of the DSC curve.
| Melting point (onset) | 81.8°C |
| Heat of fusion ΔH | 133.5 J/g |
Conclusion
The DSC is suitable for the rapid determination of melting points and heats of fusion. Additional information can be gained from a TGA measurement.
Characterization of the Melting Behavior, Vanillin | Thermal Analysis Application No. HB800 | Application published in METTLER TOLEDO TA Application Handbook Pharmaceuticals